


3 Advanced Metrics Built from CDR’s: Efficient Telecom Subscriber Behavior Analysis

Call detail records (CDR) are a valuable data source for telecom data analysts to gain information about mobile subscribers’ behavior or develop features for predictive models.
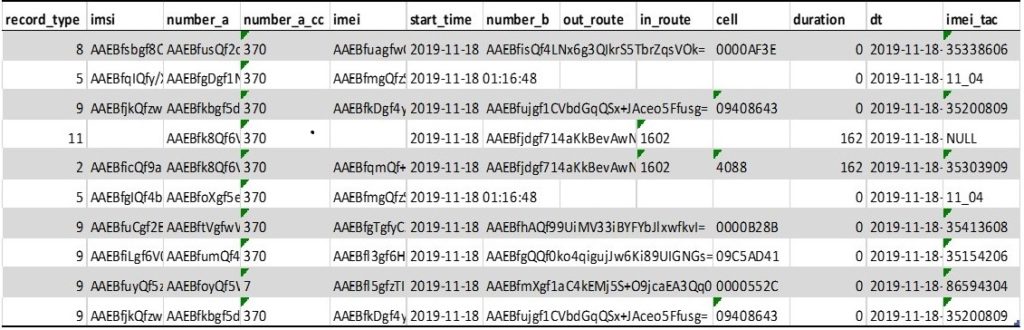
Here’s a typical CDR table:
However, call detail records analysis can be used to extract even more profound insights about individual subscribers.
Here are 3 powerful metrics about subscribers that can be derived from CDRs to improve your telecom customer segmentation and predictive model accuracy.
CDR Metric 1: Customer Activity Patterns
To better understand customer activity, data analysts typically start by calculating:
- Subscriber usage (Minutes of Use or MOU)
- MBs of use (MBU)
- SMS sent and consumption frequency (number of calls made, number of data sessions, etc.)
Different variations of these metrics can be developed using information from call detail record analysis (e.g., incoming/outgoing number of calls made, on-net/off-net SMS sent. etc.).
Although these metrics provide an understanding of customer behavior over a specific period, they do not always identify changes in activity patterns on the individual subscriber level. More advanced metrics like ‘days since last activity’ can help to detect these changes faster.
In simple terms, these metrics indicate the number of days since a specific action took place – for instance, how many days passed since the user last made a top-up or browsed the internet. If the gap between events is longer than usual, it could indicate changes in customer behavior, like disengagement or churn.
Different user consumption patterns visualized using “Days since last metrics”:
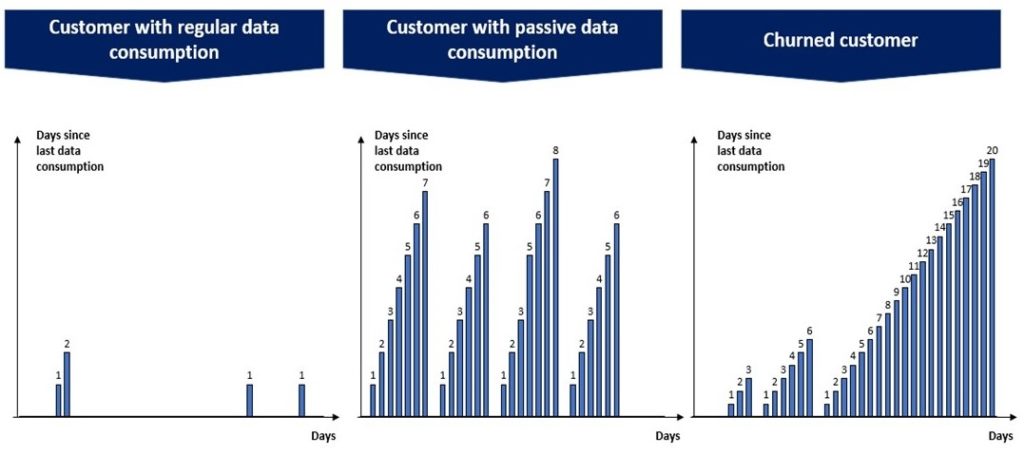
This type of data is especially beneficial when building predictive models (e.g. predicting if a customer will make a top-up in the next 7 days). There is also a significant improvement in the accuracy of the prepaid churn models when these metrics are applied.
What questions can you answer using Customer Activity Pattern metrics?
- How many subscribers completed a specific action in the last 7 days?
- How many users were inactive during the last 30 days?
- What is the typical gap of no action for an individual subscriber?
- Which customers took no action for an irregularly long time?
CDR Metric 2: Top Cell Metrics
The second type of call detail record analysis focuses on identifying the most frequently used cell in the network on an individual subscriber level.
This metric helps to analyze customer mobility and predict customer satisfaction or churn, as it contains context about where a customer is typically using the services. It doesn’t provide the exact customer location but rather an area of the tower where the top cell is located.
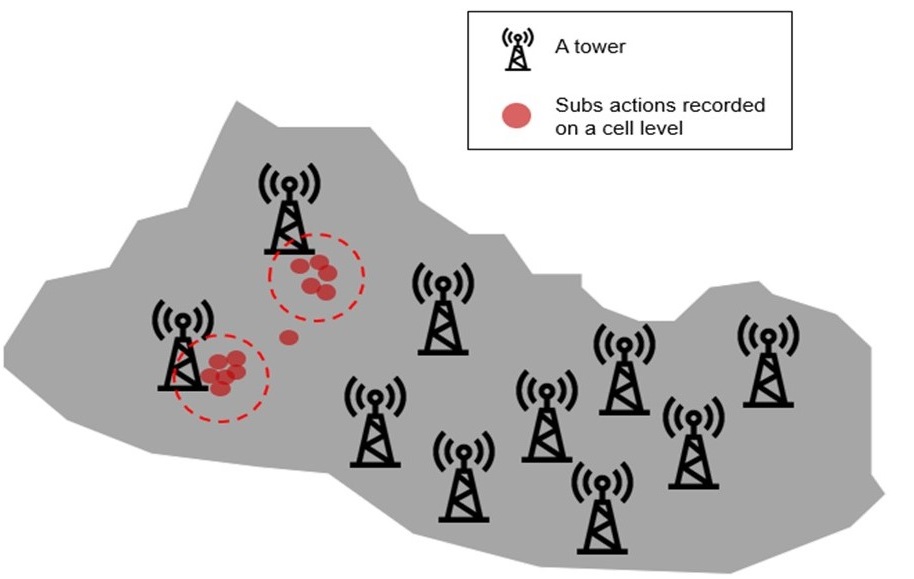
What questions can you answer using Top Cell metrics?
- What areas have the largest clusters of active subscribers at any given time?
- Which cells most frequently correlate with churning customers (could indicate potential area network issues)?
- Where is the subscriber typically located during a specific time of the day (identify home & work locations)?
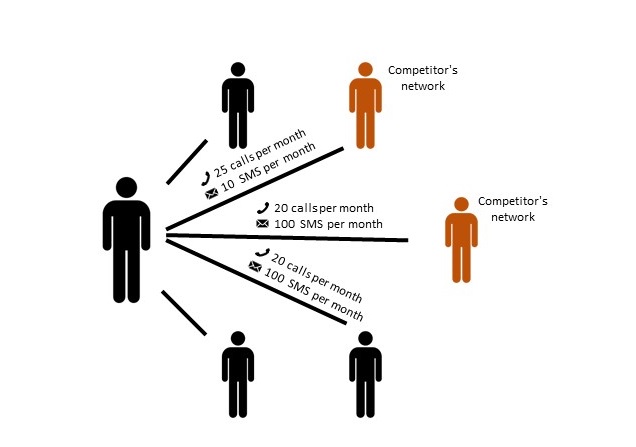
CDR Metric 3: Social Networks
This third group of metrics is used to identify subscriber social networks as a group of friends or family. By analyzing a subscriber’s frequency of calls made and sent SMS to specific MSISDNs, data analysts can gain insight into how subscribers spend their time communicating with each other.
These metrics can help guide which subscribers should be offered family deals or identify how many peers in their network have competitor services (subscribers often migrate to competitor networks used by friends or family members due to cheaper on-net calls).
Call detail record analysis provides valuable insight into subscriber behavior and helps predict future actions.
Even for experienced telco data analysts, it’s not easy to build these metrics. Remember, the metrics should be updated daily or, even better, in real-time, in order to optimize the subscriber behavior analysis or predictive models. Also, rigorous data quality and governance processes must be set-up to ensure data reliability and fast response to subscriber behavior.
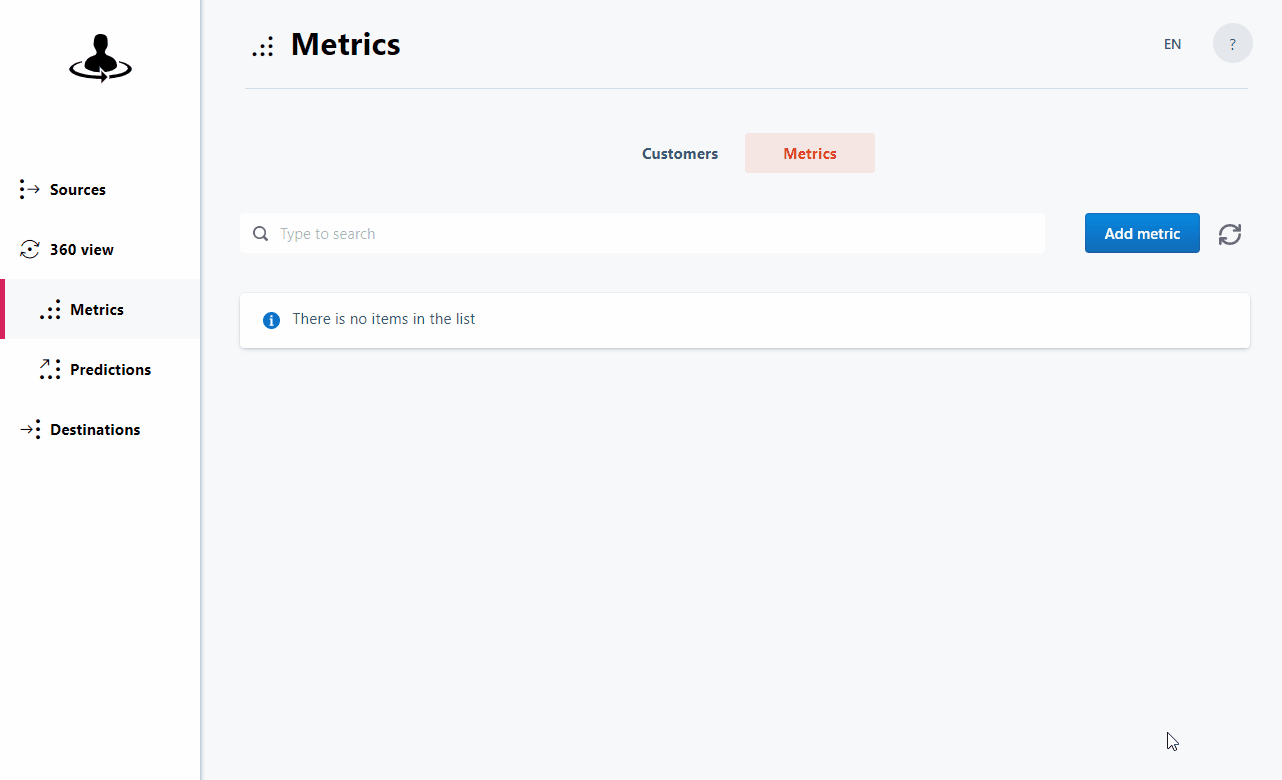
The Exacaster Customer Data Platform “Customer 360” enables companies to streamline metrics development from any data source and lets analytics teams develop, test, and automate metrics calculation with just a few clicks.
3 simple steps in Customer Data Platform
Step 1. Connect CDR source to “Customer 360” platform
Firstly, a connection between the “Customer 360” platform and the data repository with CDRs logs needs to be set-up. This connection can be set-up by following simple instructions on the platform. Exacaster “Customer 360” currently supports connections with popular data repositories based on-premise or public cloud:

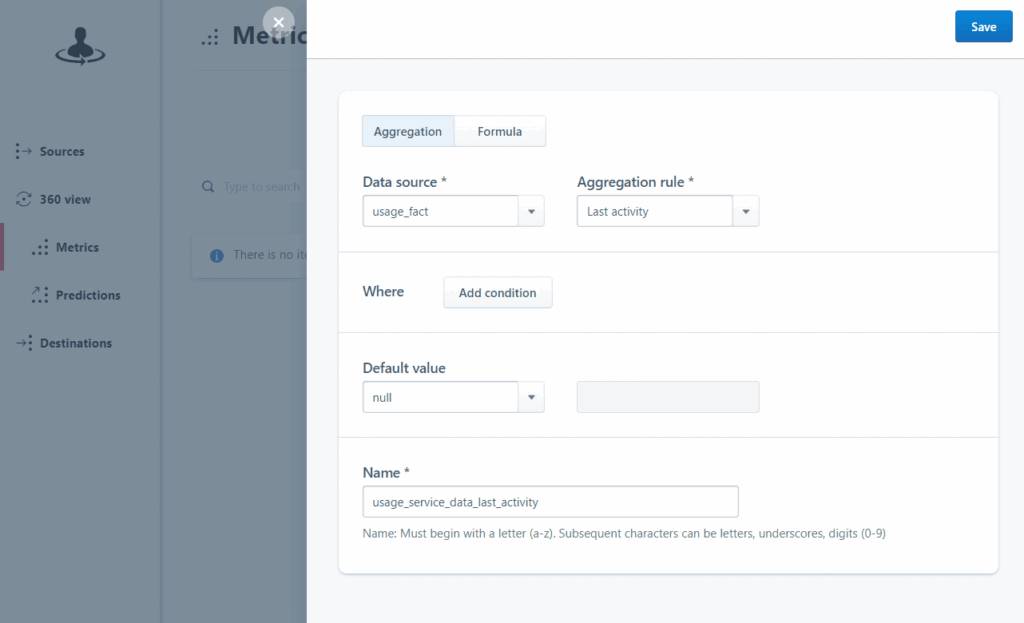
Step 2. Configure metrics
Select a source with CDR logs and choose the type of metric you would like to build (e.g. Days since last activity metrics):
Define what activity event will be tracked in the metric (e.g. data usage event):
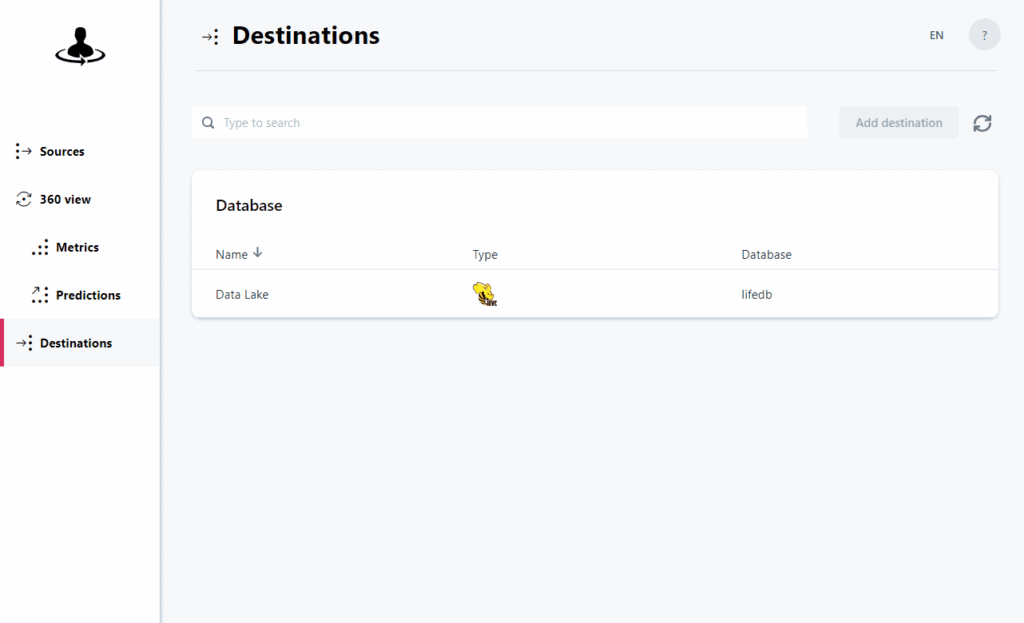
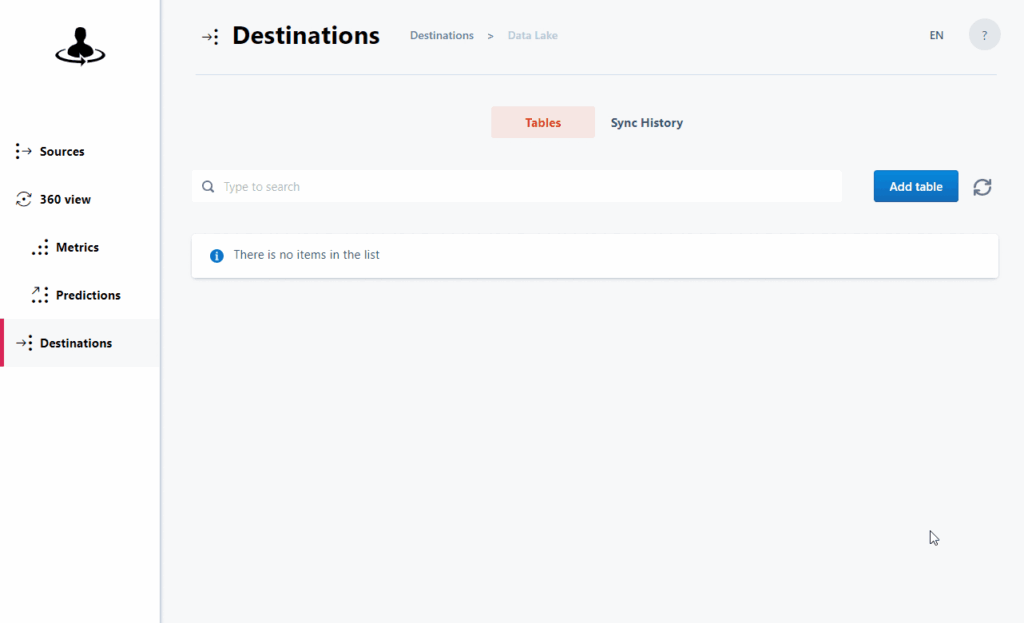
Step 3. Define the export table and destination
Select the data repository where metrics will be exported (e.g. data lake):
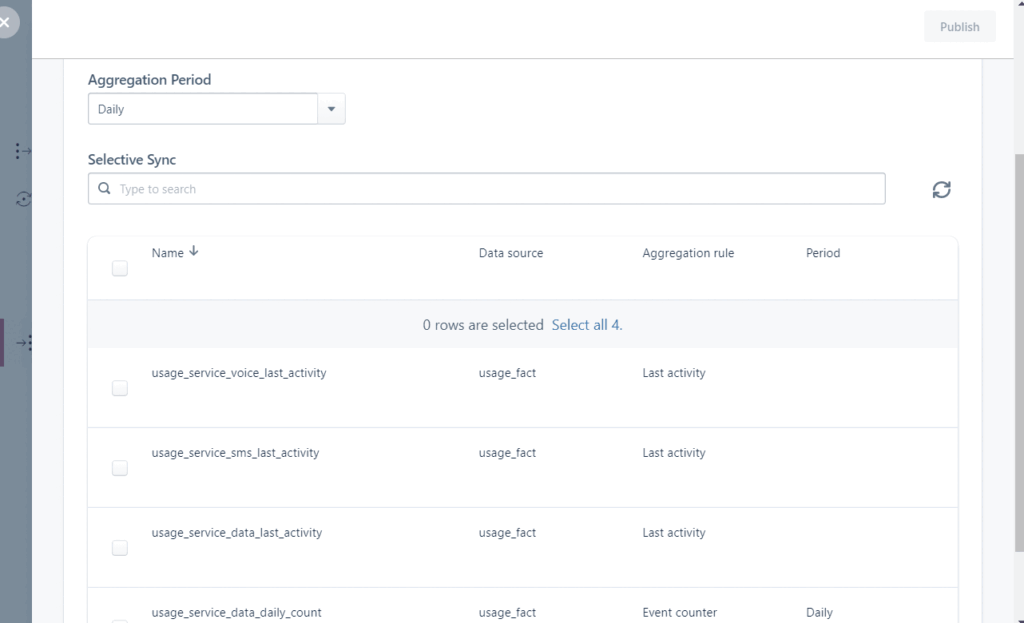
Define the name of the table and period of metrics aggregation:
Select metrics which will be exported:
The moment when configuration will be published, your configured metrics will start to be calculated and exported to your selected destination. Furthermore, metrics will be updated automatically when new records will appear in the source repository.

Agnius Valaitis - Senior Data Analyst
Agnius is a senior data analyst at Exacaster using advanced analytics and Hadoop tools to provide meaningful business insights for our customers. Agnius is a go-to person to gain insights about mobile subscribers’ behavior or features for predictive models.
What is Customer Data Platform for Telecoms?
Customer Data Platform (CDP) enables telecom tailored use cases using AI-powered algorithms:
- Customer Lifetime Value
- Retention framework
- Upsell framework
- Prepaid-to-postpaid migration framework
- Customized use cases (e.g. personalized birthday promos, invoice payment reminders, etc.)